NAME
PMWEBAPI - introduction to the Performance Metrics Web Application Programming Interface
HTTP SYNOPSIS
GET /metrics
GET /series/...
GET /search/...
GET /pmapi/...
C SYNOPSIS
#include <pcp/pmwebapi.h>
... assorted routines ...
cc ... -lpcp_web -lpcp
DESCRIPTION
The PMWEBAPI is a collection of interfaces providing Performance Co-Pilot services for web applications. It consists of APIs for web applications querying and analysing both live and historical performance data, as well as APIs used by web servers.
The usual HTTP URL-encoded optional parameter rules apply and PMWEBAPI REST requests always follow the convention:
/api/endpoint?parameter1=value1¶meter2=value2
Examples in all following sections use the curl(1) command line utility with a local pmproxy(1) server listening on port 44322 (default port). The pmjson(1) utility is used to neatly format any JSON output, as opposed to the compact (minimal whitespace) form provided by default. The examples in the scalable time series section use historical data recorded by the pmlogger(1) service, in conjunction with a local redis-server(1).
OPEN METRICS
Exporting of live performance metrics in an Open Metrics compatible format (as described at https://openmetrics.io and popularized by the https://prometheus.io project) is available.
All requests are performed on the web server host by default, unless a hostspec parameter is provided.
GET /metrics

Fetches current values and metadata for all metrics, or only metrics indicated by a comma-separated list of names.
For all numeric metrics with the given NAME prefixes, create an Open Metrics (Prometheus) text export format giving their current value and related metadata.
The response has plain text type rather than JSON commonly used elsewhere in the REST API. This format can be injested by many open source monitoring tools, including Prometheus and pmdaopenmetrics(1).
The native PCP metric metadata (metric name, type, indom, semantics and units) is first output for each metric with # PCP prefix. The metadata reported is of the form described on pmTypeStr(3), pmInDomStr(3), pmSemStr(3) and pmUnitsStr(3) respectively. If the pmUnitsStr(3) units string is empty, then none is output. The units metadata string may contain spaces and extends to the end of the line.
PCP metric names are mapped so that the . separators are exchanged with _ (’:’ in back-compatibility mode, where "# PCP" is the identifying line suffix). Both metric labels and instances are represented as Prometheus labels, with external instance names being quoted and the flattened PCP metric hierarchy being presented with each value.
$ curl -s http://localhost:44322/metrics?names=proc.nprocs,kernel.pernode.cpu.intr,filesys.blocksize
# PCP5
proc.nprocs 3.8.99 u32 PM_INDOM_NULL instant none
# HELP proc_nprocs instantaneous number of processes
# TYPE proc_nprocs gauge
proc_nprocs {hostname="app1"} 7
# PCP5
kernel.pernode.cpu.intr 60.0.66 u64 60.19 counter millisec
# HELP kernel_pernode_cpu_intr total interrupt CPU [...]
# TYPE kernel_pernode_cpu_intr counter
kernel_pernode_cpu_intr{hostname="app1",instname="node0"}
25603
# PCP5
filesys.blocksize 60.5.9 u32 60.5 instant byte
# HELP filesys_blocksize Size of each block on mounted
file[...]
# TYPE filesys_blocksize gauge
filesys_blocksize{hostname="app1",instname="/dev/sda1"}
4096
filesys_blocksize{hostname="app1",instname="/dev/sda2"}
4096
SCALABLE TIME SERIES
The fast, scalable time series query capabilities provided by the pmseries(1) command are also available through a REST API. These queries provide access to performance data (metric metadata and values) from multiple hosts simultaneously, and in a fashion suited to efficient retrieval by any number of web applications.
All requests in this group can be accompanied by an optional client parameter. The value passed in the request will be sent back in the response - all responses will be in JSON object form in this case, with top level "client" and "result" fields.
REST API clients can optionally submit an URL-encoded query string in the body of the HTTP request unless otherwise noted. In this case the POST method must be used instead of the GET method.
GET /series/query - pmSeriesQuery(3)

Performs a time series query for either matching identifiers, or matching identifiers with series of time-stamped values.
The query is in the format described in pmseries(1) and is passed to the server via either the expr parameter (HTTP GET) or via the message body (HTTP POST).
When querying for time series matches only, no time window options are specified and matching series identifiers are returned in a JSON array.
$ curl -s
’http://localhost:44322/series/query?expr=disk.dev.read*’
| pmjson
[
"9d8c7fb51ce160eb82e3669aac74ba675dfa8900",
"ddff1bfe286a3b18cebcbadc1678a68a964fbe9d",
"605fc77742cd0317597291329561ac4e50c0dd12"
]
When querying for time series values as well, a time window must be specified as part of the query string. The simplest form is to just request the most recent sample.
$ curl -s
’http://localhost:44322/series/query?expr=disk.dev.read*[samples:1]’
| pmjson
[
{
"series":
"9d8c7fb51ce160eb82e3669aac74ba675dfa8900",
"instance":
"c3795d8b757506a2901c6b08b489ba56cae7f0d4",
"timestamp": 1547483646.2147431,
"value": "12499"
}, {
"series":
"ddff1bfe286a3b18cebcbadc1678a68a964fbe9d",
"instance":
"6b08b489ba56cae7f0d4c3795d8b757506a2901c",
"timestamp": 1547485701.7431218,
"value": "1118623"
}, {
"series":
"605fc77742cd0317597291329561ac4e50c0dd12",
"instance":
"c3795d8b757506a2901c6b08b489ba56cae7f0d4",
"timestamp": 1547483646.2147431,
"value": "71661"
}
]
GET /series/values - pmSeriesValues(3)
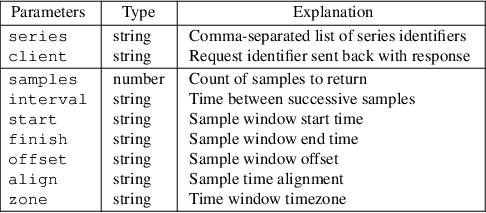
Performs values retrievals for one or more time series identifiers. The JSON response contains the same information as the pmseries -q/--query option using any of the time window parameters described on pmseries(1). If no time window parameters are specified, the single most recent value observed is retrieved.
$ curl -s
http://localhost:44322/series/values?series=605fc77742cd0317597291329561ac4e50c0dd12
| pmjson
[
{
"series":
"605fc77742cd0317597291329561ac4e50c0dd12",
"timestamp": 1317633022959.959241041,
"value": "71660"
}
]
GET /series/descs - pmSeriesDescs(3)

Performs a descriptor lookup for one or more time series identifiers. The JSON response contains the same information as the pmseries -d/--desc option.
$ curl -s
http://localhost:44322/series/descs?series=605fc77742cd0317597291329561ac4e50c0dd12
| pmjson
[
{
"series":
"605fc77742cd0317597291329561ac4e50c0dd12",
"source":
"f5ca7481da8c038325d15612bb1c6473ce1ef16f",
"pmid": "60.0.4",
"indom": "60.1",
"semantics": "counter",
"type": "u32",
"units": "count",
}
]
GET /series/labels - pmSeriesLabels(3), pmSeriesLabelValues(3)

This command operates in one of three modes. It can perform a label set lookup for one or more time series identifiers, when given the series parameter). It can produce a list of all known label names, in the absence of name, names or series parameters. The JSON responses for these modes contains the same information as the pmseries -l/--labels option.
Alternatively, it can produce a list of all known label values for a given label name or names. The JSON response for this mode contains the same information as the pmseries -v/--values option.
$ curl -s
http://localhost:44322/series/labels?series=605fc77742cd0317597291329561ac4e50c0dd12
| pmjson
[
{
"series":
"605fc77742cd0317597291329561ac4e50c0dd12",
"labels": {
"agent": "linux",
"domainname": "acme.com",
"groupid": 1000,
"hostname": "www.acme.com",
"latitude": -25.28496,
"longitude": 152.87886,
"machineid":
"295b16e3b6074cc8bdbda8bf96f6930a",
"platform": "dev",
"userid": 1000
}
}
]
Alternatively, with no name, names or series parameters, return the list of all known label names.
$ curl -s
http://localhost:44322/series/labels | pmjson
[
"agent",
"appversion",
"domainname",
"groupid",
"hostname",
"jobid",
"latitude",
"longitude",
"machineid",
"platform",
"userid"
]
Use the name or names parameters to find all possible label values for the given name(s).
$ curl -s
http://localhost:44322/series/labels?names=hostname,domainname
| pmjson
{
"hostname": [ "app", "nas" ],
"domainname": [ "acme.com" ]
}
GET /series/metrics - pmSeriesMetrics(3)

Performs a metric name lookup for one or more time series identifiers. The JSON response contains the same information as the pmseries -m/--metrics option.
$ curl -s
http://localhost:44322/series/metrics?series=605fc77742cd0317597291329561ac4e50c0dd12
| pmjson
[
{
"series":
"605fc77742cd0317597291329561ac4e50c0dd12",
"name": "disk.dev.read_bytes"
}
]
Alternatively, with no series argument, this request will return the list of all known metric names.
$ curl -s
http://localhost:44322/series/metrics | pmjson
[
"disk.dev.read",
"disk.dev.read_bytes",
"disk.dev.read_merge",
"kernel.all.load",
"kernel.all.pswitch",
...
]
GET /series/sources - pmSeriesSources(3)

Performs a lookup for one or more time series sources, returning an array of all PMAPI context names used to access the time series from that source. The JSON response contains the same information as the pmseries -S/--source option.
$ curl -s
http://localhost:44322/series/sources?source=2cd6a38f9339f2dd1f0b4775bda89a9e7244def6
| pmjson
[
{
"source":
"2cd6a38f9339f2dd1f0b4775bda89a9e7244def6",
"context": [
"/var/log/pcp/pmlogger/acme",
"www.acme.com"
]
}
]
GET /series/instances - pmSeriesInstances(3)

Provide instance identifiers and names for one or more time series identifiers. The JSON response contains the same information as the pmseries -i/--instance option.
$ curl -s
http://localhost:44322/series/instances?series=605fc77742cd0317597291329561ac4e50c0dd12
| pmjson
[
{
"series":
"605fc77742cd0317597291329561ac4e50c0dd12",
"source":
"97261ac7742cd4e50c0d03175913295d12605fc7",
"instance":
"c3795d8b757506a2901c6b08b489ba56cae7f0d4"
"id": 1,
"name": "sda",
}, {
"series":
"605fc77742cd0317597291329561ac4e50c0dd12",
"source":
"97261ac7742cd4e50c0d03175913295d12605fc7",
"instance":
"57506a2901c6b08b489ba56cae7f0d4c3795d8b7"
"id": 2,
"name": "sdb",
}
]
Alternatively, with no series argument, this request will return the list of all known instance names.
$ curl -s
http://localhost:44322/series/instances | pmjson
[
"1 minute",
"5 minute",
"15 minute",
"cpu0",
"cpu1",
"cpu2",
"cpu3",
"node0",
"node1",
"sda",
"sdb",
...
]
GET /series/load - pmSeriesLoad(3)

Load time series performance data from the specified source into the redis-server cache. This request is equivalent to the pmseries -l/--load option.
$ curl -s
http://localhost:44322/series/load?expr={source.name:"/var/log/pcp/pmlogger/acme"}
{
"success": true
}
FULL TEXT SEARCH
The full text search capabilities provided by the pmsearch(1) command are also available through a REST API. These queries provide access to an index over performance metric names, instances, instance domains and help text, suitable for a metric search engine, and in a fashion suited to efficient querying by any number of web applications.
In order to use this functionality, the optional RediSearch module must be loaded in the redis-server at the time pmproxy is started, such that metrics, instances and help text it discovers can be automatically indexed.
GET /search/text - pmSearchTextQuery(3)
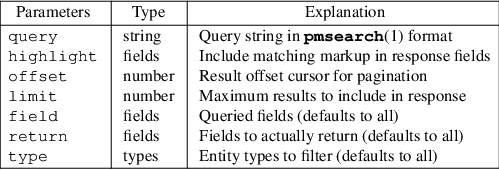
Performs a text search query across metrics and instance domains - all forms of names and help texts.
The mandatory search string is further described in pmsearch(1) and is passed to the server via the query parameter (HTTP GET).
$ curl -s
http://localhost:44322/search/text?query=halt | pmjson
{
"total": 2,
"offset": 0,
"limit": 10,
"elapsed": 0.000504,
"results": [
{
"name": "kvm.halt_exits",
"type": "metric",
"indom": "95.0.4",
"oneline": "Number of guest exits due to halt
calls.",
"helptext": "This type of exit is usually
seen when a guest is idle."
},
{
"name": "kvm.halt_wakeup",
"type": "metric",
"indom": "95.0.6",
"oneline": "Number of wakeups from a
halt.",
}
]
}
The available search entity types are metric, indom and instance. Query parameters highlight and field take name, oneline and helptext.
Query parameter return takes name, type, oneline, helptext, indom. There is typically both a name and help text associated with metrics. Contents of these are then matched against query. An instance domain has help text and a numeric identifier, while instances have a name only (which can be searched).
GET /search/suggest - pmSearchTextSuggest(3)

Provides search query suggestions, that is, metric and instance names.
The mandatory search string is further described in pmsearch(1) and is passed to the server via the query parameter (HTTP GET).
$ curl -s
http://localhost:44322/search/suggest?query=disk&limit=4
| pmjson
[
"disk.all.avactive",
"disk.all.aveq",
"disk.all.blkread",
"disk.all.blktotal"
]
GET /search/indom - pmSearchTextInDom(3)

Provides all entities (instances, metrics) related to indom, including itself, that is passed to the server via the query parameter.
GET
/search/info - pmSearchInfo(3)
Provides metrics relating to operation of the search engine,
in particular showing document and text record counts.
$ curl -s
http://localhost:44322/search/info | pmjson
{
"docs": 1589,
"terms": 3855,
"records": 116831,
"records_per_doc_avg": 73.52,
"bytes_per_record_avg": 6.36,
"inverted_sz_mb": 0.71,
"inverted_cap_mb": 0.00,
"inverted_cap_ovh": 0.00,
"skip_index_size_mb": 0.00,
"score_index_size_mb": 0.00,
"offsets_per_term_avg": 9.41,
"offset_bits_per_record_avg": 8.00
}
PMAPI HOST SERVICES
The live performance collection facilities available from pmcd(1) can also be accessed through a REST API.
All requests are performed on the web server host by default, unless either a hostspec or context parameter is provided. hostname can be used in place of hostspec.
Context identifiers are used as a persistent way to refer to PMAPI contexts across related web requests. These contexts expire after a configurable period of disuse, and are either explicitly allocated using the /pmapi/context interface, or implicitly allocated using other interfaces.
The timeout interval is configurable at context creation time, and as such the polltimeout parameter can be used anywhere the hostspec is specified. It sets the context timeout in terms of length of inactive time. The unit for the timeout value is seconds and the default is 5.
To specify a specific existing context in any PMAPI web request, the endpoints can be accessed with either the context parameter or embedded in the endpoint URL itself, such as /pmapi/[number]/fetch.
GET /pmapi/context - pmNewContext(3)

To create a context for live sampling, a web client can access any /pmapi URL (optionally using the hostspec or context parameter). If no context exists, a new one will be created for that web client, and its identifier returned for future accesses.
However, /pmapi/context is provided as a dedicated URL for applications wishing to explicitly create the contexts they use.
If successful, the server responds with a HTTP 200 (OK) code and JSON message body of the form:
$ curl -s
http://localhost:44322/pmapi/context?hostspec=www.acme.com&polltimeout=0.5
| pmjson
{
"context": 348734,
"source":
"05af7f3eb840277fd3cfa91f90ef0067199743c",
"hostspec": "www.acme.com",
"labels": {
"domainname": "acme.com",
"groupid": 1000,
"hostname": "www.acme.com",
"machineid":
"295b7623b6074cc8bdbda8bf96f6930a"
"platform": "dev",
"userid": 1000
}
}
The context (a 32-bit unsigned decimal number) can then be used with all later requests.
In the case of a hostspec containing authentication information, such as a username, the server will follow the HTTP Basic Authentication protocol to ascertain necessary authentication details from the user, providing the client web application an opportunity to request these from the user.
GET /pmapi/metric - pmLookupDesc(3), pmLookupLabels(3), pmLookupName(3), pmLookupText(3)
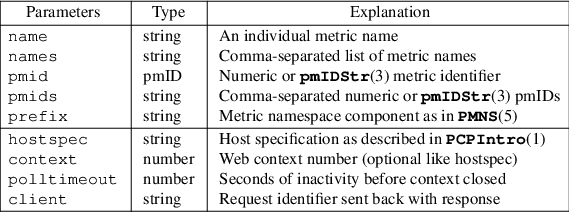
The metric endpoint provides detailed PMAPI metric metadata for one or more metrics. If no parameters are supplied, the response will be for all metrics found when traversing the entire Performance Metrics Name Space (PMNS).
The prefix parameter can be used to specify a subtree of the PMNS for traversal. Alternatively, a specific metric or comma-separated list of metrics can be specified using either name or names
The server response is a JSON document that provides metric metadata as an array.
$ curl -s
http://localhost:44322/pmapi/metric?names=kernel.all.load,disk.all.read
| pmjson
{
"context": 348734,
"metrics": [
{
"name": "kernel.all.load",
"pmid": "60.2.0",
"indom": "60.2",
"type": "FLOAT",
"sem": "instant",
"units": "none",
"series":
"d2b28c7f6dc0d69ffd21dba7ba955e78c37719b",
"source":
"05af7f3eb840277fd3cfa91f90ef0067199743c",
"labels": {
"agent": "linux",
"domainname": "acme.com",
"groupid": 1000,
"hostname": "www.acme.com",
"platform": "dev",
"userid": 1000
},
"text-oneline": "1, 5 and 15 minute load
average"
},
{
"name": "disk.all.read",
"pmid": "60.0.24",
"type": "U64",
"sem": "counter",
"units": "count",
"series":
"d2b28c7f6dc0d69ffd21dba7ba955e78c37719b",
"source":
"05af7f3eb840277fd3cfa91f90ef0067199743c",
"labels": {
"agent": "linux",
"domainname": "acme.com",
"groupid": 1000,
"hostname": "www.acme.com",
"platform": "dev",
"userid": 1000
},
"text-oneline": "total read operations,
summed for all disks",
"text-help": "Cumulative number of disk read
operations [...]"
}
]
}
Most of the fields are directly transcribed from the PMAPI calls for metric descriptors, labels and help text mentioned above and are exactly as would be observed using the pminfo(1) command with the -dlmstT options.
The semantics, type and units fields are as returned by pmTypeStr(3), pmUnitsStr(3) and pmSemStr(3).
GET /pmapi/fetch - pmFetch(3)
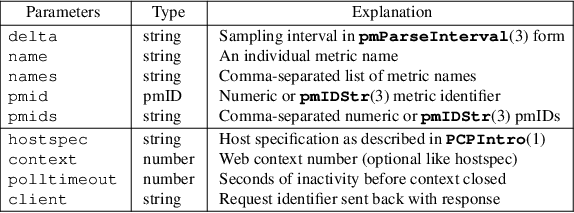
This request fetches (samples) current values for given metrics.
If any of the names or pmids provided are valid, the response is a JSON document that provides the values for all instances of the metrics, unless a instance profile has been set for the web context (see section on InDom profiles below).
$ curl -s
http://localhost:44322/pmapi/fetch?names=kernel.all.load,disk.all.read
| pmjson
{
"context": 348734,
"timestamp": 1547483646.2147431,
"values": [
{
"pmid": "60.2.0",
"name": "kernel.all.load",
"instances:" [
{ "instance": 1, "value": 0.1 },
{ "instance": 5, "value": 0.17 },
{ "instance": 15, "value": 0.22 }
]
},
{
"pmid":"60.0.24",
"name":"disk.all.read",
"instances:" [
{ "instance": null, "value": 639231 }
]
}
]
}
The response fields map directly to fields from the underlying pmFetch(3) sampling interface.
Numeric metric types are represented as JSON integer or floating-point values. Strings are passed verbatim, except that non-ASCII values are replaced with a Unicode 0xFFFD replacement character code.
In backward compatibility mode the timestamp is presented as a JSON map with second (sec) and microsecond (us) fields, instead of using the more compact floating point representation shown above.
GET /pmapi/children - pmGetChildren(3), pmGetChildrenStatus(3)

The children endpoint provides iterative namespace traversal for a context. If no parameters are supplied, the response will describe the direct descendants of the Performance Metrics Name Space (PMNS) root.
The prefix parameter can be used to specify a subtree of the PMNS for traversal.
The server response is a JSON document that provides the set of leaf and non-leaf nodes below the given namespace node or root.
$ curl -s
http://localhost:44322/pmapi/children?prefix=mem | pmjson
{
"context": 348734,
"name": "mem",
"leaf": [
"physmem",
"freemem"
],
"nonleaf": [
"util",
"numa",
"vmstat",
"buddyinfo",
"slabinfo",
"zoneinfo",
"ksm"
]
}
GET /pmapi/indom - pmGetInDom(3), pmNameInDom(3), pmLookupInDom(3)
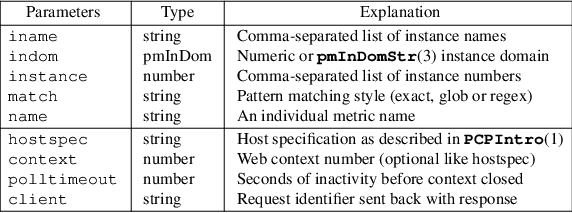
This request lists the current instances of an instance domain. The instance domain is either specified directly (in numeric or string form) or indirectly, by association with the specified metric.
The request can be further qualified with a comma-separated list of the instances to report on, either by name or number, using the instance and iname parameters.
In the case of instance name qualifiers, these will be matched by exact string comparison by default. Alternatively, the match parameter can be used to specify that regular expression or glob pattern matching should be used instead.
The response is a JSON document that provides the instance domain metadata as an array.
$ curl -s
http://localhost:44322/pmapi/indom?name=kernel.all.load |
pmjson
{
"context": 348734,
"indom": "60.2",
"labels": {
"domainname": "acme.com",
"groupid": 1000,
"hostname": "www.acme.com",
"machineid":
"295b7623b6074cc8bdbda8bf96f6930a"
"platform": "dev",
"userid": 1000
},
"instances": [
{
"instance": 1,
"name": "1 minute"
"labels": { ... },
},
{
"instance": 5,
"name": "5 minute"
"labels": { ... },
},
{
"instance": 15,
"name": "15 minute"
"labels": { ... },
}
]
}
GET /pmapi/profile - pmAddProfile(3), pmDelProfile(3)
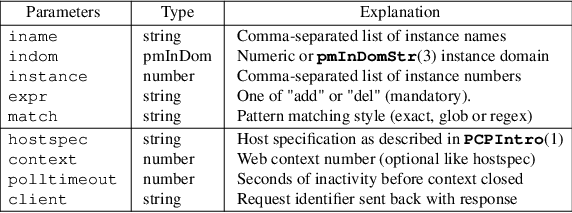
Some PMAPI operations can be performed with an active instance domain profile which restricts (filters) the set of resulting instances returned, as described on pmAddProfile(3).
$ curl -s
http://localhost:44322/pmapi/profile?expr=add,indom=60.2,iname=1%20minute
{ "context": 348734, "success": true
}
GET /pmapi/store - pmStore(3)
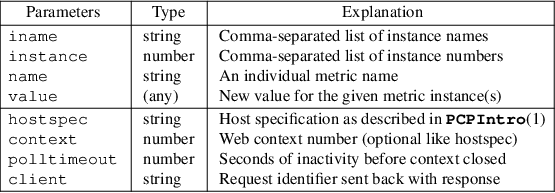
Some performance metrics allow their value to be modified, for example to re-initialize counters or to modify control variables.
This operation takes a single metric name to modify, and optionally specific instances. The mandatory value will be interpreted according to the type of the metric being modified.
If successful, the response from these requests is a JSON document of the form:
$ curl -s
http://localhost:44322/pmapi/store?name=pmcd.control.timeout&value=10
{
"context": 348734,
"success": true
}
GET /pmapi/derive: pmAddDerived(3)

Create a new derived metric, as defined by the pmAddDerived(3) metric interface. Derived metrics are associated with the named context, or a new context is created and returned in the result.
This interface is one of the few that allows a POST to be used in place of a GET. In this case the HTTP POST request body may be used to provide one or more derived metrics specifications (all at once, across multiple lines, as a convenience).
$ curl -s
http://localhost:44322/pmapi/derive?name=blkio.avgsz&expr=disk.all.blktotal/disk.all.total
| pmjson
{
"context": 348734,
"success": true
}
$ curl -s
http://localhost:44322/pmapi/fetch?name=blkio.avgsz&samples=2
| pmjson
{
"context": 348734,
"timestamp": 1547483648.2147428,
"values": [
{
"pmid": "511.0.27",
"name": "blkio.avgsz",
"instances:" [
{
"instance": null,
"value": 9231
}
]
}
]
}
GET /pmapi/metrics: pmLookupDesc(3),pmLookupLabels(3), pmFetch(3)

This request is a subset of the style described in the ’’OPEN METRICS’’ section, allowing a web context identifier to be passed as a parameter. It is otherwise very similar in terms of parameters and response handling, please refer to the earlier section for details.
NOTES
For the REST APIs, errors generally result in HTTP-level error responses. Wherever possible, any PMAPI error string will also be provided in a message along with the response.
All responses will be returned using HTTP 1.1 protocol and with chunked encoding being used to stream responses that are larger than a configured maximum size. Compression will be used on responses whenever the client indicates appropriate support.
An Access-Control-Allow-Origin: * header is added to all REST API responses.
SEE ALSO
PCPIntro(1), curl(1), pmcd(1), pmdaopenmetrics(1), pminfo(1), pmjson(1), pmlogger(1), pmproxy(1), pmseries(1), redis-server(1), PCPIntro(3) and PMAPI(3)